


How to make a result sheet of students
Result sheet
Today I am going to teach you a very interesting topic that how to create a “result sheet”. In this topic we will create a “high school” result. We will work on some functions which are “Sum”, “Min”, “Mix”, “Average” and “IF”. Follow these steps which are given below to create a result sheet.
1) Start “MS Excel” program
2) Fill your data by these information “SNO”, “Name”, “F/Name”, “English”, “Chemistry”, “Mathematics”, “Physics”, “Biology”, “Drawing”, “History”, “Total Marks”, “Marks Obtained”, “Minimum no”, “Maximum no”, “Average”, and “Grade”. Bold your text and then fill it by your own information as given below.


3) Use this function in first cell of “Marks Obtained” which is given above. =sum(F5:L5) As you will type this function “=sum(F5:L5)”. After type it press “Enter”. As you will press “Enter” our value will directly define as given below.
4) “=sum(F5:L5)” In this function the first is =. = we use it at the beginning of every function and number second is “Sum”. Sum function is use for adding of value and the last think of this function is (F5:L5) is the area of values that we want to add. (F5:L5) means (F5 cell to L5).
5) Now follow these steps which are given below.


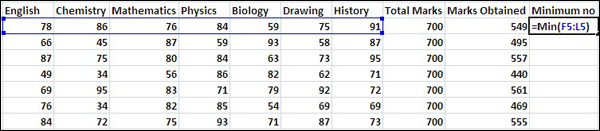
6) The next column is about “Minimum no”. In this column we will find the minimum no of paper that what the minimum mark is. To find the minimum no of paper type this function at first cell of “Minimum no” column “=Min(F5:L5)” as given below.
7) Drag “Minimum no” column also like “Marks Obtained”.
8) Now we are going to work on “Maximum no” column that how to find the maximum no of paper. To fine the maximum no of paper we use the function “=max(F5:L5)” as given below.


After type of function press “Enter” and drag it as given below.

10) The last think is to find the “Grade” of your marks. To find the Grade first of all click on the first cell as given above and then type in “Formula bar” as given below.
 After click on “Formula bar” type the below function
7) Drag “Minimum no” column also like “Marks Obtained”.
8) Now we are going to work on “Maximum no” column that how to find the maximum no of paper. To fine the maximum no of paper we use the function “=max(F5:L5)” as given below.
After type of function press “Enter”. As you will press “Enter” the value will define. Drag it below.
9) Now is the turn of to find the “Average” of your marks. To find the average of mark type this function at the first cell of “Average” column =Average(F5:L5) as given below.After type of function press “Enter” and drag it as given below.
10) The last think is to find the “Grade” of your marks. To find the Grade first of all click on the first cell as given above and then type in “Formula bar” as given below.

=IF(N5>=550,"Grade A",IF(N5>=450,"Grade B",IF(N5>=400,"Grade C",IF(N5>=350,"Grade D","Failed"))))

Press “Enter” and drag it as given before.
11) Select your Result sheet and click on “Outside broders” and then select a color of background and then click on it as given below.

This was our topic of the day I hope we like it.


3 comments:
Hello,
Thank you for this lecture.
It s bn long I ve bn itching to learn this. And you present it so simple.
Hi there again,
How can the individual student's report sheet be generated from this excel sheet?
Kool,, thanks,,
Post a Comment